Examples
Next.js example
How to set up your development flow on a Next.js project. You can follow this tutorial step by step if you are starting a new project or jump to a section that is relevant for you.
Setup a new Next.js project
To set up a new Next.js project you refer to the example project in Next.js docs. This example contains Playwright as an end-to-end testing framework.
Terminal
Debugging in dev mode
Setting up your environment
Replay is a great development companion. Whenever you stumble upon an error, you can back up and replay what happened. To set up your development environment install Replay CLI:
Terminal
Recording your application
Let’s assume you have started your dev server on localhost:3000.
Once Replay CLI is installed, you can create a replay by typing the following command in your terminal:
Terminal
This command opens Replay Browser and starts recording your application running on localhost. Once you have caught the issue in Replay Browser, you can go back to the terminal and press any key to stop recording.
Running for the first time
If you are running Replay CLI for the first time, you may be prompted to log in to Replay App. To learn more about Replay CLI, jump to this page.
Recording an issue will help you capture the root cause. Once you have a replay, you can jump into time-travelling DevTools, explore source files and add console.log to explore the runtime.
Debugging your application
After you record your application, you will be prompted to upload your replay. Command line interface will generate a link which you can view in any browser.
Terminal
Take a look at this public replay to see an example of how Replay DevTools look.
What to debug
You can create replays any time you encounter an issue. Replays are very effective when facing intermittent issues, race conditions, router problems, or any issue that either happens too quickly or is hard to identify.
We recommend creating shorter replays for better performance and clarity.
Debugging Playwright tests
Installing the Playwright Plugin package into your project
The Next.js with-playwright project is initialized with a playwright.config.ts file. This contains many useful defaults for running your tests locally. To add Replay, you need to install the Replay plugin for Playwright and make updates to the config file.
Terminal
After the installation, you’ll need to modify two attributes in the playwright.config.ts file:
reporterprojects
Your modified file will look like this (we removed the comments that are added by default)
playwright.config.ts
Recording your tests
If you are experiencing issues with your tests, such as random failures or flakiness, you can record your tests simply by running the replay-chromium project. The upload: true attribute will take care of uploading every test replay after the test run.
You can choose to set this setting to false and use replayio upload command from CLI to upload your test recordings manually.
For examples on how to record your tests on a CI pipeline, check out reference docs or examples on how to record a Vercel preview deployment.
Generating API key
In order to upload your replays, an API key needs to be set up in your environment. Check out the reference guide to learn how to generate an API key
Debugging your tests
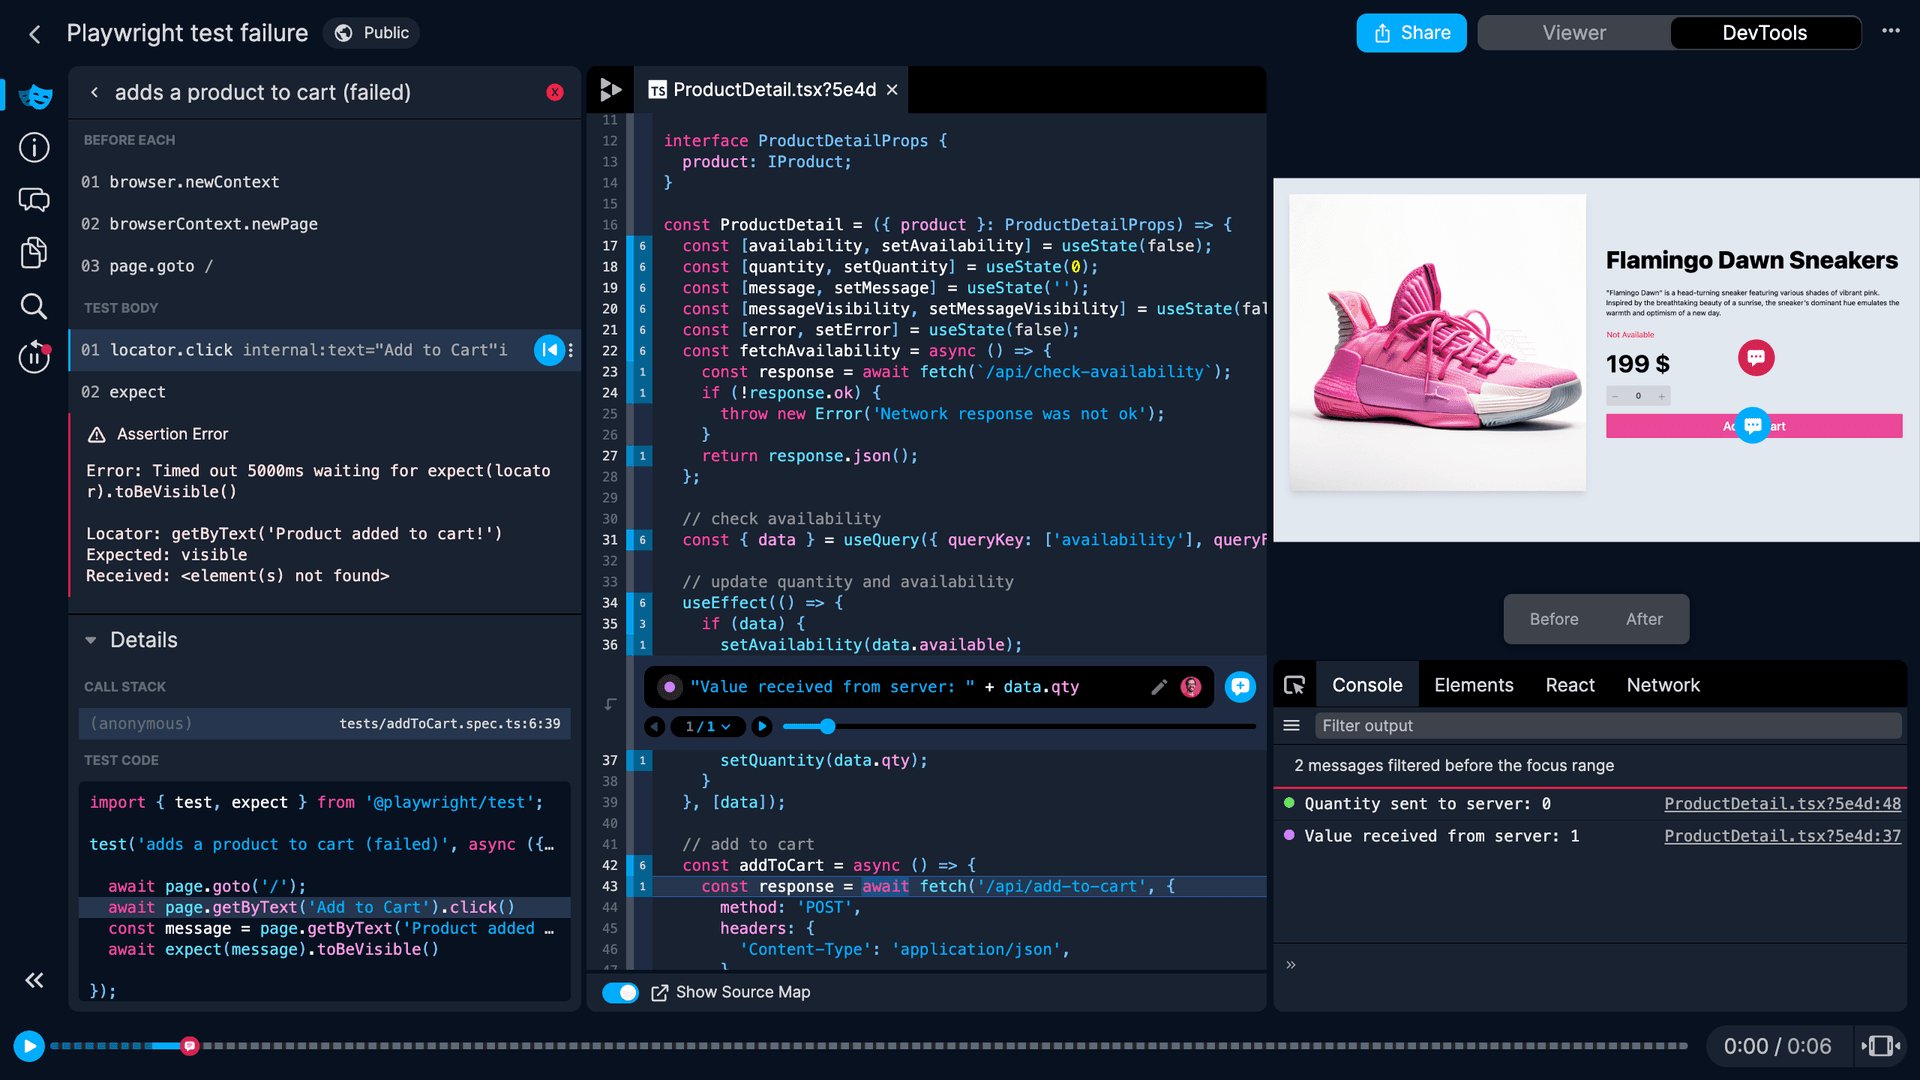
Replay DevTools bring you the power of browser DevTools, but with time traveling capability. This becomes incredibly useful for cases like shown here.
This example shows an ecommerce site, where two API calls are called. One checks availability of items, and other one adds it to cart. The availability gets fetched and a quantity state is updated.
ProductDetail.tsx (abbreviated)
The quantity state is then used as payload in the "add to cart" request.
ProductDetail.tsx (abbreviated)
However, depending on the speed of response from /api/check-availability endpoint, the quantity will either be 0 (the default value) or 1 (fetched value).
This problem can be revealed by adding console.logs into the replay. These will reveal the race condition happening in the failed test vs. passing test.
Check out this replay for a detailed walkthrough on debugging a flaky Playwright test.
Comparison with trace-viewer
Trace-viewer is a powerful tool for reviewing your Playwright test run. It contains screenshots, network logs, step details and a timeline of DOM snapshots. It can help you zoom into each test step and examine visuals and logs from the application.
Replay takes this concept further. You are getting all the advantages of trace-viewer with the added capability of exploring your source code adding console.logs to reveal the flow of your data and ability to jump to any line of code. You can stop at a perfect moment that is not captured by any DOM snapshot from trace-viewer, or is simply happening in between these snapshots.
When facing flaky tests, reproducing an issue locally is no longer needed, because all of the information is already captured.
You can read more about comparison with Playwright’s trace-viewer here.
Learn how to record your tests, manage your test suite and debug flaky tests using Replay DevTools
Debugging Vercel branch preview deployments
Learn how to run debug tests from your Vercel preview deployments
PR comments
The Replay GitHub PR comment makes it easy to view a PR's recent runs.